8.11
Lecture 30: More Performance
1 Purpose
Explain how to get more detailed performance information
2 Outline
Last time, we learned how to measure the performance of code. This is a
helpful start, but it doesn’t necessarily tell you how to make the code faster,
if you have decided it needs to be faster!
Often, you can look at a given function and figure out a way to make it faster.
But why should you spend time making one function faster (and more complicated,
harder to read, etc) rather than another?
To figure out where the time is spent, we can’t just measure the whole
program, we instead want to know relative time: what functions occupy
how much time. Then we can focus our time on the actual places that will make
the code faster, rather than spending time on parts that don’t matter.
Consider the following program:
|
|
| (define (is-bigger-than-100? n) | | (> n 100)) |
|
|
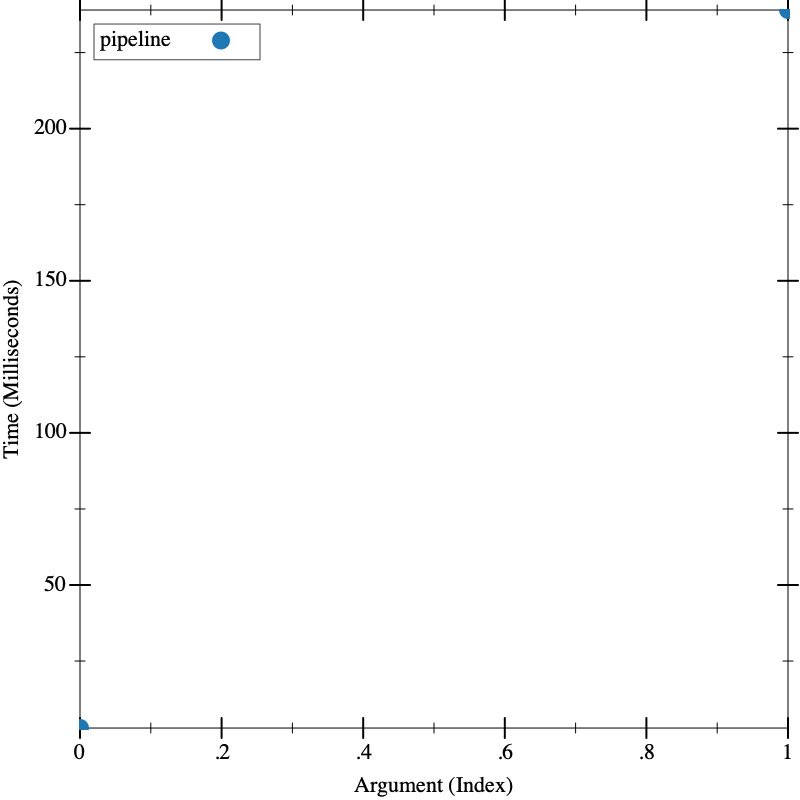
We can time this as a whole, and figure out its pretty slow, testing on a list
with 1000 and 10000 elements.
Now, the program includes two things that might be slow: a really naive
primality test (divide by every number up to the number in question), and a
count of occurrences over the whole list (making a computation O(n^2)). Which do
you think takes more time? How much more?
We can speculate on this, and with practice, at least on simple cases like this,
we might be able to get the answer correct, but on large systems with thousands
of methods, any number of which might be initially written naively (as is
often a good idea, if the code is easier to read), eyeballing it won’t work.
Instead, we can run a profiler. What a profiler does is sample periodically:
there is a separate process running concurrently to the program, and every few
milliseconds, it records the current "call stack": the call stack is the current
function that is executing and the function it returns to, and the function that
returns to, etc. If the program runs long enough, these samples can then be used
to provide an idea of how much time is spent in which functions: if they show up
in the sample a lot, then a lot of the time the program must have been there.
Reading the output of profilers can be difficult, since they give percentages
spent in functions, but the percentages don’t add to 100%, since a function is
counted when it is anywhere on the call stack. It’s actually much easier to
understand this using a visualization called a Flame Graph, created by a Netflix
performance engineer Brendan Gregg. Flame Graphs are a language independent
idea, but we’ll use a Racket library profile-flame-graph that profiles
Racket code and, provided you have Brendan’s library is your PATH, will generate
an SVG and open it in your browser automatically.
You can see the output of the FlameGraph tool, which is an interactive SVG, here:
l30-1.svg
This clearly shows that the primality test is essentially irrelevant. Since the
filter removes so many of the values, even if an individual call to prime?
is as slow (or slower!) than a call to count-occurrences, there is no point
in optimizing prime? if the goal is to make the program faster.
Instead, we should figure out a faster way to count occurrences. Since the order
doesn’t actually matter, one way of doing that would be to first sort the
numbers, and then count the adjacent numbers up, replicating the eventual count
the appropriate number of times.
Now, clearly, we should check if this kind of refactoring produced equivalent
code. This is an obvious use for both property-based and unit testing. Since we
are in Racket here, we don’t have LSL’s normal facilities, and I don’t want to
bring in a separate library, but we can easily apply ideas from PBT to run a
one-off test that
| (define (pipeline-equiv-prop lon) | | (equal? (pipeline lon) | | (pipeline2 lon))) |
|
|
#t |
What this is doing is generating random lists of 10000 elements, all of them
numbers under 50. It then calls our two pipeline functions and makes sure they
always agree. We could obviously run more tests!
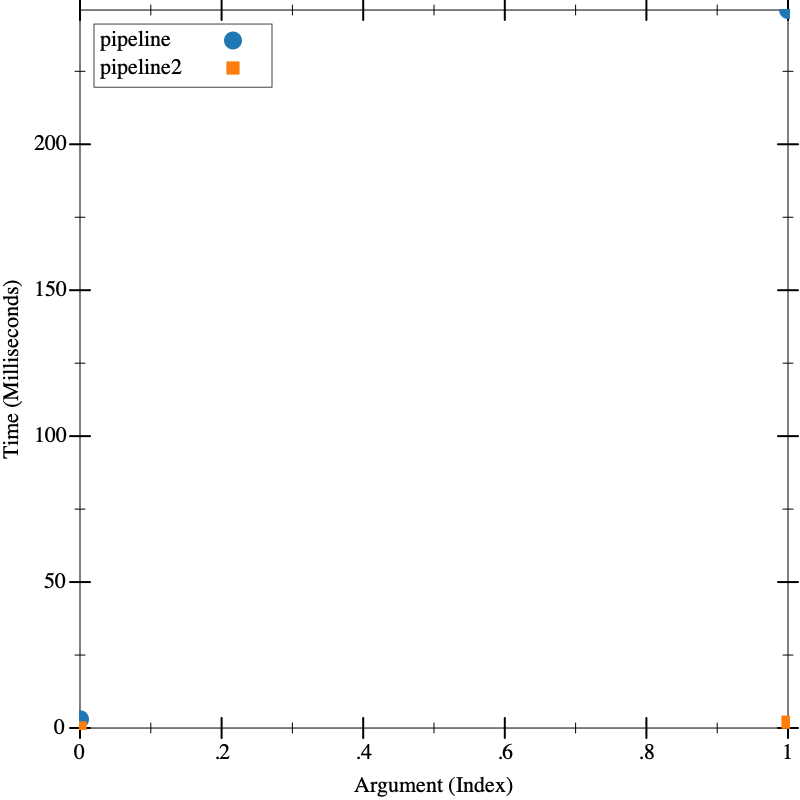
But now, let’s re-run our original timing test on both pipeline and
pipeline2: since the inputs are random, it’s important that we run this in
a single call to visualize, so we aren’t getting "lucky" or "unlucky" in
one of the runs: the two functions are operating on the same input.
The difference is dramatic. Since we chose the right thing to optimize, we made a huge difference in the overall performance.
With this modified program, we can run our profiler again. It might be that
now, the prime? test has a more significant impact.
l30-2.svg
And we can see that it does! Almost half the time is now spent in the
prime? test. So if we could make that faster, we would be able to make our
overall program faster. But its only worth it now to consider doing that, once
we fixed the overwhelming performance problem. And it might be that we end up
deciding the program is plenty fast enough!
Now, what would have happened if we instead decided to optimize prime? Just
looking at the code, we could see that it was a naive algorithm. For the
particular application we have: testing prime numbers under a certain bound,
this is a good application for pre-computing all the primes and then just
checking membership. An efficient algorithm for this is known as the Sieve of
Eratosthenes – essentially, you take a list of all numbers 2...n, and then
remove all multiples of 2, then all multiples of 3, then all multiples of 5,
etc. This can be expressed very concisely as the following generative recursive
program, where we then define a constant for a sieve of the primes under 100000.
This will be enough for our application (much more than we likely will need,
actually).
We can then use the sieve to define a fast primality test as:
(Note that in Racket, member returns the tail of the list if it finds a
match and #f otherwise, and there is no member?, so to turn it into a
boolean predicate we just check whether we got a cons)
As before, we want to make sure our function is equivalent. Obviously,
prime? works on arbitrary sized input, but we are only using it on numbers
under 100,000.
| (define (prime?-equiv-prop n) | | (equal? (prime? n) | | (prime?-fast n))) |
|
|
#t |
Now that we have that faster definition, we can try implementing pipeline3,
which uses prime?-fast instead of prime?. Remember, this is instead of
pipeline2, so we are still using the slow count-occurrences, as we
said this is what would have happened if we didn’t profile and just guessed that
prime? was the problem.
We should check, as before, that we didn’t change the meaning. Obviously, since
we did this check for prime?, we hope this would pass, but we did make
assumptions about the size of inputs in that test, so its good to do this one as
well:
| (define (pipeline3-equiv-prop lon) | | (equal? (pipeline lon) | | (pipeline3 lon))) |
|
|
#t |
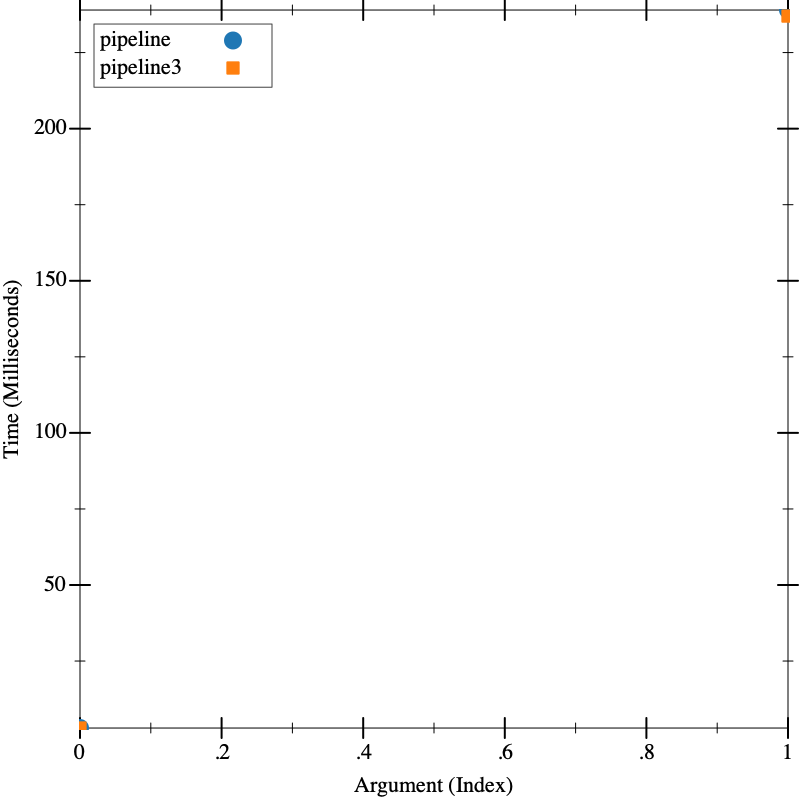
And finally, we can do our performance test:
Now, this shows that, as expected, it made very little difference.
However, if we first did the optimization of pipeline2, and then did this as a second one, we can construct a pipeline4 that includes both:
Again, we should check that this change didn’t change the meaning. This time,
we’ll use as our reference pipeline2:
| (define (pipeline4-equiv-prop lon) | | (equal? (pipeline2 lon) | | (pipeline4 lon))) |
|
|
#t |
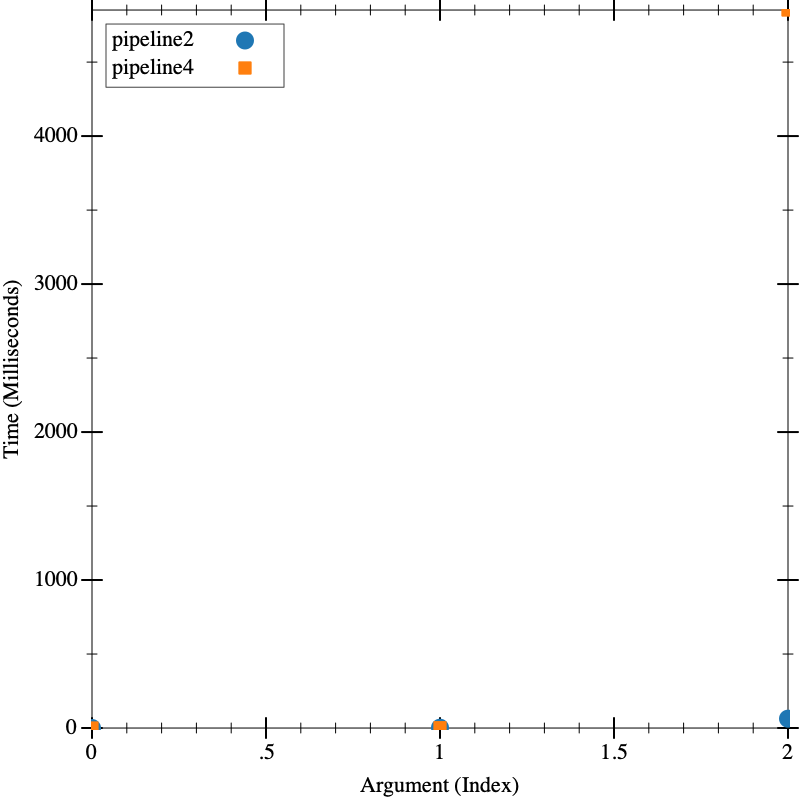
Now we can performance test pipeline4 against pipeline2. Since both
should be quite fast, we bump the input to test on one order of magnitude larger
as well, to make sure we are getting a good test:
Now, we get a somewhat surprising result. pipeline4 is much slower than
pipeline2! Our "naive" primality test is much faster. Since the only
difference is prime? vs prime?-fast (poorly named!), we can
investigate that directly. And if we think about what happens with a
non-prime number, we realize member will look through the whole
list: it doesn’t understand that the list is ordered, and that it doesn’t have
to look once it finds a number that is bigger than what it is searching for.
We can fix this by updating prime?-fast:
|
| (define (prime?-fast-equiv-prop n) | | (equal? (prime?-fast n) | | (prime?-faster n))) |
|
|
#t |
And we can make an updated pipeline5 using this:
|
| (define (pipeline5-equiv-prop lon) | | (equal? (pipeline5 lon) | | (pipeline4 lon))) |
|
|
#t |
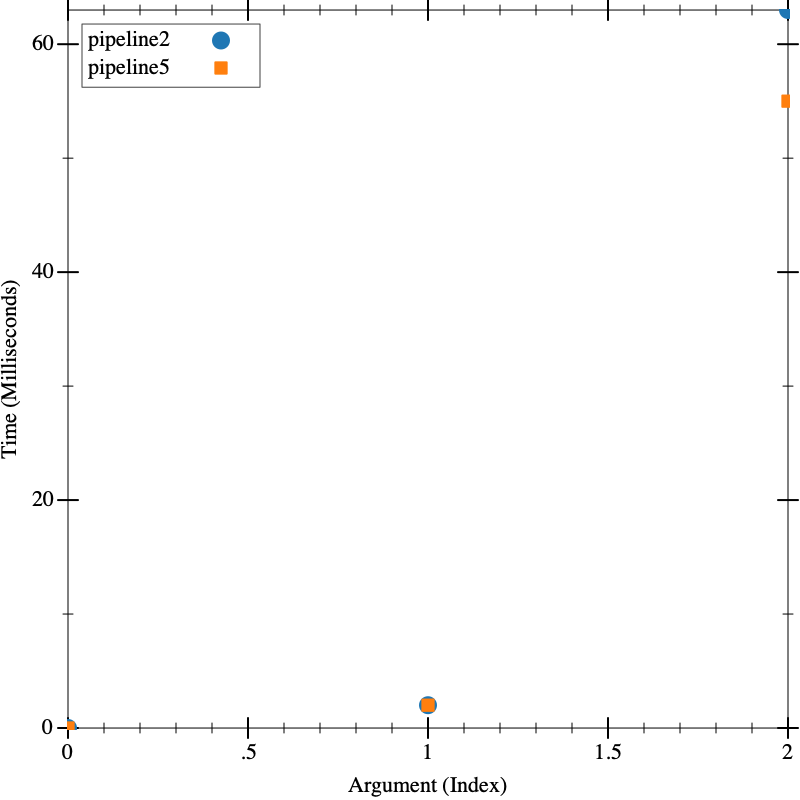
And finally, we can re-benchmark that against pipeline2:
Which is essentially as expected. Our profiling information suggested that, once
we improved the speed of count-occurrences, roughly half the time was spent
in prime?, so if we could dramatically speed that up, we could maybe see a
significant difference, which we do. On even bigger inputs, the difference might
be even more significant.
