Assignment 9: The Easy Animator
This assignment is to be completed with a partner or by yourself. You will sign up with your partner ( or just yourself ) on the handin server as a team from this assignment onwards. You will not be able to submit subsequent assignments until you are part of a team on the handin server. Note that even if you are working by yourself you still need to signup as a team of one on the handin server. The same teams stay for the next assignment, therefore there will be no need for you to signup for a team again.
Note that you will need to work with your partner to submit the self-eval. As with the code, one partner will submit a single self-eval for the team. However, you will likely need to sit with your partner or be on the phone as you should agree on all the responses.
If you do not know how to request teams, follow these instructions. Please request teams no later than 6 days before the deadline of the assignment.
The Easy Animator: Part 1
This assignment starts with a context of the application, followed by a clearer outline of what you must achieve. This assignment does not spell out explicitly which interfaces, classes, methods and variables you need. Understanding what the application must do, and designing accordingly is an important part of this assignment.
You do not need to have any prior knowledge of animation to complete this series of assignments.
Context
A picture is worth a thousand words, and moving pictures are worth many more.
Pictures and moving pictures (animations) can be used to succinctly and effectively illustrate many things. For example, a stationary histogram visually depicts the distribution of some data points. A histogram with moving bar heights visually depicts music (e.g. a music equalizer). Animating graphs can be used to show useful trends in data much more effectively than presenting the same reasoning using raw numbers and text (see here for a visualization of the trend of life expectancy with GDP over time using only circles). A fireworks display is simply a bunch of points moving in certain ways. The Towers of Hanoi problem can be illustrated more effectively as an animation solving it, rather than a description of steps of an algorithm. Many algorithms can be similarly visualized in a way that illustrates how they work more succinctly than descriptions or code. Here are some examples of such visualizations:
|
|
|
|
 A simple animation
 Towers of Hanoi
One of the more frustrating experiences is knowing what to visualize, having a plan for how to visualize it using simple shapes and animations, but not being able to quickly create such an animation. Creating animations takes time, and one must learn the necessary tools that are often difficult to master (e.g., using Flash, or creating Web animations using HTML5 and Javascript, etc.). Such tools are often also special-purpose. For example, the statistical package R comes with charting capabilities, but code must be written in R and data must be formatted accordingly. Similarly creating animations is not difficult in Powerpoint, but the tool is embedded in Powerpoint and one cannot use it to create other kinds of animation.
In the next few assignments, we will build an application that helps to create simple but effective 2D animations from shapes (such as the above examples). One of our main goals will be to create a separation between how an algorithm or phenomenon is described and how it is drawn on the screen. This separation will allow us to create an application that will draw an animation according to how it is described in text, without being tied to how the description was produced. This process is illustrated below:
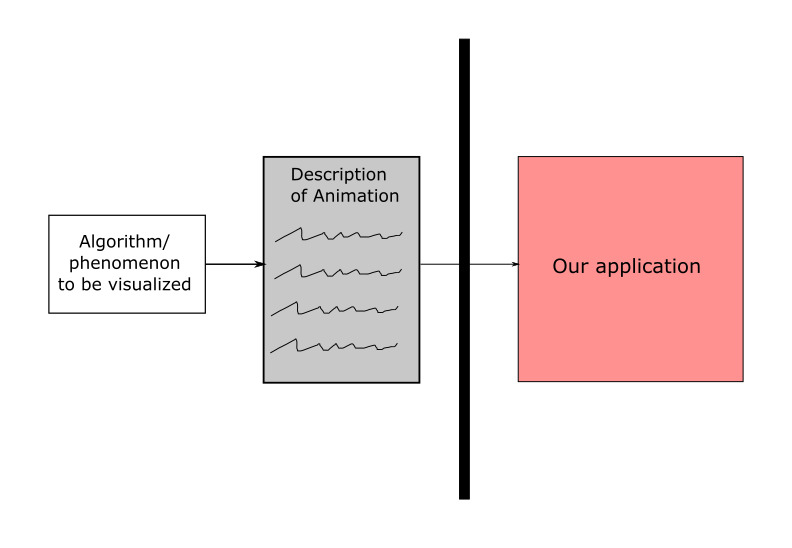
In other words, our application will show animations generated manually or using any other program, unrelated to our application.
Description of animation
In informal language, here is an example description of the animation for the "Simple Animation" example above:
Create red rectangle R with corner at (200,200), width 50 and height 100 Create blue oval C with center at (500,100), radius 60 and 30 R appears at time t=1 and disappears at time t=100 C appears at time t=6 and disappears at time t=100 R moves from (200,200) to (300,300) from time t=10 to t=50 C moves from (500,100) to (500,400) from time t=20 to t=70 C changes from blue to green from time t=50 to t=80 R moves from (300,300) to (200,200) from time t=70 to t=100 R changes width from 50 to 25 from time t=51 to t=70
As you can see, we describe the animation in terms of what should happen when according to a timeline when the animation plays. This is called “declarative animation.” Imagine how you would describe informally the above Towers of Hanoi animation in this way.
We use a time reference for each step in the animation. This time reference is usually unitless, which helps us in describing animation without mentioning its absolute speed. Further, the animation must adhere to certain constraints. For example, one cannot have move the same rectangle to the left and right during overlapping time intervals.
Our application may then use such a description to:
"Show" the animation in various ways. For example interactively play it, describe it on a time line, or even export the animation as a Flash movie.
Allow a user to edit it or change speed.
Produce a verbose description for what the animation will look like (for the visually impaired).
Other possibilities...
The Easy Animator Application
We will build this application progressively using the classic Model-View-Controller architecture. In this assignment we will focus on the model of this application. There is no starter code for this assignment: you must use the above description and broad ideas to design the interface and implementation of the model. You are deliberately not being told about the fine details of what the controller and views will need or do. You are also not being told about how exactly the application will receive a description from the user (it would not be relevant to the model).
Here are some aspects to think about:
What does the model represent?
The model should be able to support various kinds of 2D shapes, although currently we have described only rectangles and ovals.
The model should support adding various kinds of animations to shapes, such as moving, changing color, changing shape, etc. For now we will concentrate only on moving, scaling and changing color (see above animations for examples).
Remember to think from not only the implementor’s perspective (the person that is implementing the model) but also the client perspective (the person or class that is using the model).
How is the animation seen?
One way the application may show the animation is by actually playing it, similar to the moving images above. Another way would be to produce a text description of the animation. Here is what a description might look like:
Shapes: Name: R Type: rectangle Min corner: (200.0,200.0), Width: 50.0, Height: 100.0, Color: (1.0,0.0,0.0) Appears at t=1 Disappears at t=100 Name: C Type: oval Center: (500.0,100.0), X radius: 60.0, Y radius: 30.0, Color: (0.0,0.0,1.0) Appears at t=6 Disappears at t=100 Shape R moves from (200.0,200.0) to (300.0,300.0) from t=10 to t=50 Shape C moves from (500.0,100.0) to (500.0,400.0) from t=20 to t=70 Shape C changes color from (0.0,0.0,1.0) to (0.0,1.0,0.0) from t=50 to t=80 Shape R scales from Width: 50.0, Height: 100.0 to Width: 25.0, Height: 100.0 from t=51 to t=70 Shape R moves from (300.0,300.0) to (200.0,200.0) from t=70 to t=100
In short, it first describes the shapes that are part of the animation and their details. Next it describes how these shapes will move as the animation proceeds from start to finish. You may think of this output as a “read-back” of the animation, perhaps for devices that cannot show the animation, or for users who are visually impaired who have screen readers.
What to do
Design a model to represent an animation. This may consist of one or more interfaces, abstract classes, concrete classes, enums, etc. Consider carefully what operations it should support.
Think about and include in the model interface operations that you think are relevant and the model should offer.
Document your model well. Be sure to document clearly what each method does, what purpose it serves and why it belongs in the model.
Implement your model. Only if you do not know how to implement the method because it requires details of animation not provided yet, you may leave the method body blank for now. This will convey to us that you think the method ought to be part of the model.
Test your model.
Implement the text output rendering of your model according to the format given in the above section, so we can visualize your data. We will not be autograding this assignment, but you should emulate the output above as precisely as possible, as we will be checking it (on models constructed from input files we provide) on future assignments.
What to submit
Submit any files created in this assignment, along with a text README file explaining your design. Your README file should give the graders an overview of what the purposes are for every class, interface, etc. that you include in your model, so that they can quickly get a high-level overview of your code. It does not replace the need for proper Javadoc! An UML class diagram in additon to the README is highly encouraged. It will help you understand your desing, and it will also help the graders.
Grading standards
the design of your model interface(s), in terms of clarity, flexibility, and how plausibly it will support needed functionality;
the appropriateness of your representation choices for the data (please comment on why you chose the representation you did in the code);
the forward thinking in your design, in terms of its flexibility, use of abstraction, etc.
the correctness and style of your implementation, and
the comprehensiveness and correctness of your test coverage.
Submission
Please submit your homework to https://handins.ccs.neu.edu/ by the above deadline. Then be sure to complete your self evaluation by its due date.