Homework 5

Due Date Friday, October 11 at 6pm
Purpose To design a small program using structured data.
You should submit a single .rkt file containing your responses to all exercises via the Handin Server. We accept NO email submissions. Failure to submit a .rkt file will result in a 0.
You are only allowed to use the language specified at the top of this page: failure to do so will result in a 0.
Your code MUST conform to the guidelines outlined in the style guide on the course website. The style guide will be updated as the semester progresses so please remember to read it before submitting each assignment.
You must follow all the steps of the design recipe when completing this assignment.
Please be sure to look at the feedback for assignment 3 before submitting, as we will be grading you more harshly on things we have warned you about before.
You must submit this assignment with your partner, assigned in lab on Tuesday, October 1st.
Graded Exercises
Exercise 1 Design the function str-in-list-even?/v1, which determines if a given string occurs in a list of strings an even amount of times. Your implementation should count up the number of instances and then determine if this count is even. (Of course you should design a list of strings first...)
Exercise 2 Now, design the function str-in-list-even?/v2, which utilizes the following observation: notice that each time the supplied string occurs in the list, if the previous result was true, the new result is false. You do not need to re-design your data and are welcome to re-use the tests from the previous problem.
Exercise 3 Design the function all-the-nums, which sums every number in a list of list of numbers.
Exercise 4 Design the function flatten, which converts a list of list of numbers into a single list of numbers. You should use your data designed in the previous problem. Hint: the append function will be quite useful.
Exercise 5 A slideshow consists of a list of slides. A slide has a title, a list of bullet points that are currently being shown, and a list of bullet points that have yet to be shown. The following represents the start of a data design for this description (where an LoS is a list of strings, as you previously defined):
(define-struct slide [title shown hidden]) ; A Slide is a (make-slide String LoS LoS) ; and represents a slide's title, ; what bullets have been shown (top to bottom) ; and which are hidden (top to bottom) ; A Slideshow is one of: ; - empty ; - (cons Slide Slideshow) ; and represents an ordered slideshow Design the function, strong-singularity, which takes in a Slideshow and interactively visualizes it. Slides should always display their title and whatever bullets are not hidden. The user should be able to advance the slideshow by pressing the right arrow key. Advancing the slideshow when there are no more hidden bullets on the current slide should move the slideshow to the next slide. Advancing the slideshow when there are more hidden bullets should display the first hidden bullet at the bottom of what was already shown. The program should display a black screen when the slideshow ends, which should also end the program. The program should return a Boolean indicating whether the user completed the slideshow.
You must finish designing the data above, but do not need to re-design list of strings.
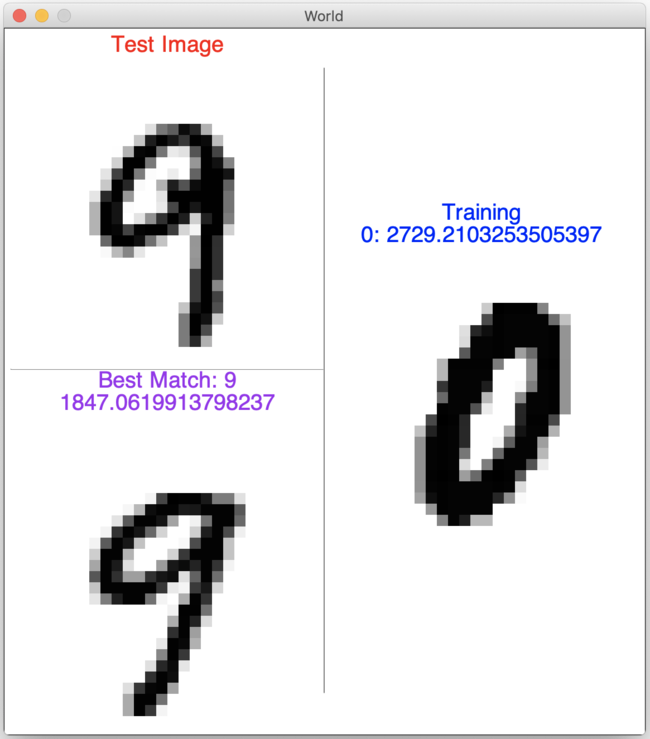
The project for this semester is to use Machine Learning to teach the computer how to predict a digit being represented in an image of hand-written numbers. For example, in the image below, you clearly see a pair of nines on the left and a zero on the right, but without some training, the computer just "sees" pictures and can only guess as to their corresponding digit. It’s technology like this that allows the Post Office to efficiently route snail-mail based upon handwritten zip codes, as well as Google Maps to automatically label buildings with their street number (via video captured from their roaming cars).
As a first step towards this ambitious goal, your task in this assignment is to design the data you will build on for the rest of the semester.
Exercise 6 Design data for each description below. Be sure to follow all the steps of the design recipe for data.
Images are great for visualization purposes, but it is often useful to break them down into smaller pieces, each of which can give clues as to the overall meaning(s) of the picture. For example, if I tell you a picture of a creature has eight legs, you might guess it’s an arachnid.
There are many ways to break down images into these smaller pieces, each termed a Feature, but the simplest, and the one we will use here, will be that of a pixel, which is a small dot of a single color. Even simpler, we’ll only consider shades of grey (or greyscale), which can be represented as whole numbers between 0 and 255 (0=white, 255=black). The template won’t be very helpful here so you don’t need to include it.
Now that you have designed a single Feature, there are two useful ways to represent entire images. The first is a grid (rows and columns) of features, termed a Bitmap representation. Consider the example Bitmap below...
254
255
255
255
0
253
252
255
255
This arrangement of Features could be interpreted as a very small, simple 0 (dark grey/black pixels surrounding a white center).
The second way of arranging Features is as a single, flattened sequence, which we’ll term an Instance. For example, we could represent the previous Bitmap example as the following Instance...
254
255
255
255
0
253
252
255
255
which was produced by starting at the top-left, proceeding to the right through each column, and then down to each row.
Hopefully it’s clear that both of these representations have the same Features, but are potentially useful in different ways. Whereas the Bitmap representation is useful for visualization, the Instance representation (termed a vector in mathematics), is easier for performing calculations on all the Features or comparing features between two Instances (where the original row/column isn’t as important as relative position within the image).
Machine Learning can sometimes feel like math class at school: you are first trained with problems, for which you know/are told solutions, and then, after you study these, you are tested on new problems you haven’t seen before.
In the case of the project, you will be supplied with multiple Training images, in which you will know (and tell your program) the corresponding digit that was written. Each Training image will be stored in a file as a Bitmap and you will need to keep track of a visualization of that Bitmap, its Instance representation, as well as the corresponding digit (0-9). The hope is that Machine Learning can take advantage of these Training examples to intelligently make predictions about future images it hasn’t seen...
Note that we are asking you to include an Image as part of the Training data type. Ordinarily we try not to include images in our data, because we want to separate the model (the data) from the view (the visual representation of that data). This concept will come up again and again in future classes and is known more formally as the MVC pattern. For now, just know that this is the only time when it is allowable to use images as your data.
Speaking of which, we call these images with unknown contents Testing images. The file format will be the same (a Bitmap of Features), but you won’t know the corresponding digit (rather, it will be the job of your eventual program to predict this!). For Testing images, you will need to keep track of the visualization of the Bitmap, as well as the Instance representation of the Features.
Looking back to the screenshot, the picture in the upper left is the Testing image currently being considered, whereas the right of the window is a keyboard-scrollable list of Training images, each with the associated known digit (e.g., 0). Note: we are asking you to design two distinct types of data here: Training and Testing.
The Machine Learning technique you are going to learn and implement for this project represents a very simple idea: we can make a (sometimes accurate) prediction about the digit corresponding to an image by identifying its "closest" Training image and then guessing that they represent the same digit. This is called the 1-Nearest Neighbor classifier, where neighbors are Training images in this case. We’ll get into more details later in the semester, including how you define how close/distant two images are, but for now just believe we can :)
To ground this idea, look back one more time to the screenshot above. Here we’ve computed the distance between each Training image on the right and the Testing image (e.g., the distance between the 0 and the 9 is about 2729) and it turns out that the Neighbor with the smallest distance (i.e., the nearest Neighbor) was one of the 9’s (with a distance of about 1847) and so it was given a special place in our program, the bottom left.
SO, the final data you need to design is that of a Neighbor: a pairing of a Training and a number greater than or equal to 0, representing the distance between that Training image and a Testing image in question.