Predicting Water Pump Failures In The Agriculture Sector

Summary

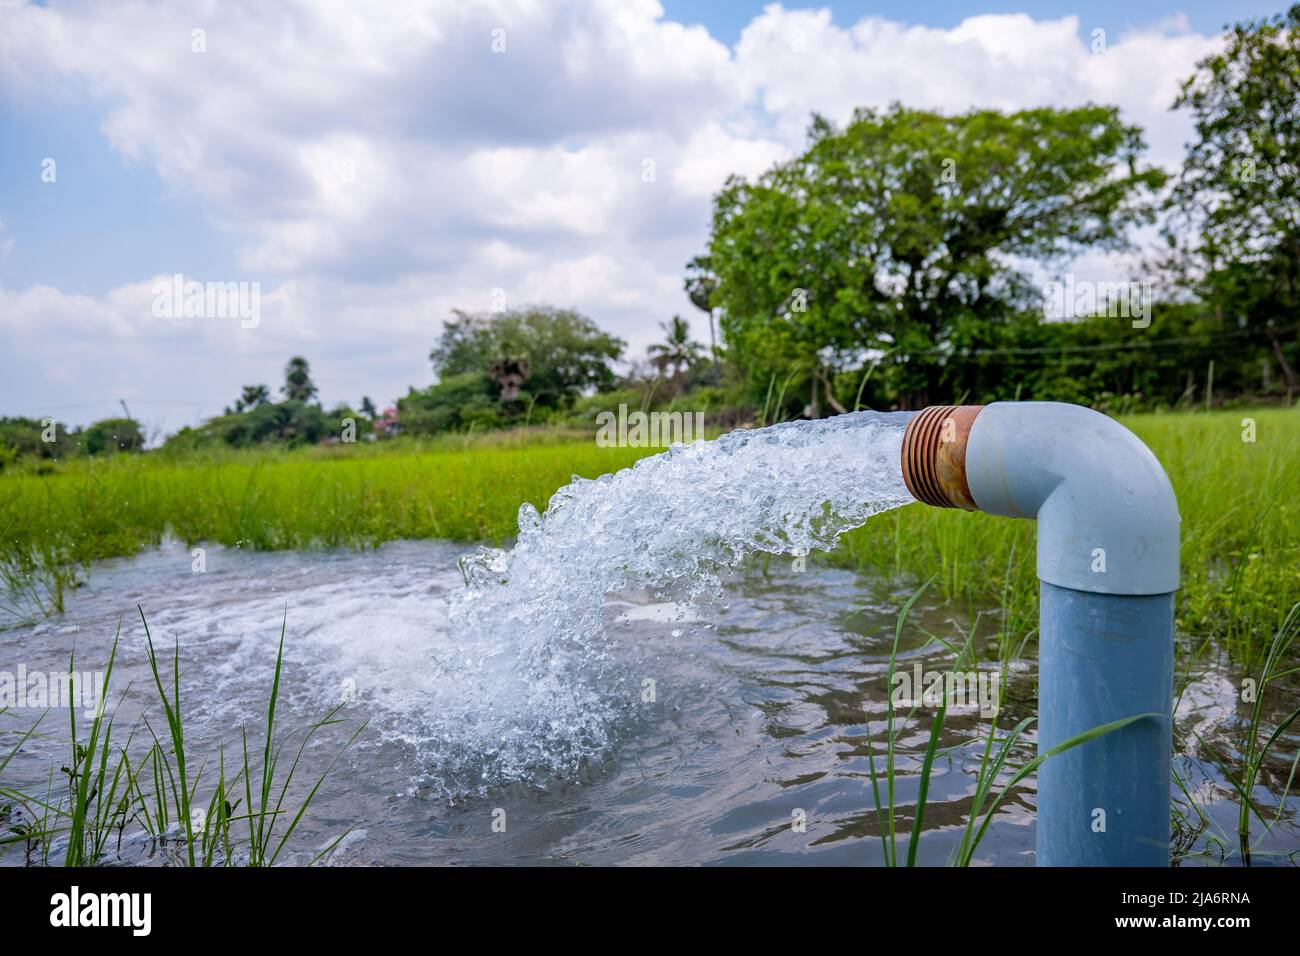
Water is essential for human beings across the world, especially in towns and remote areas where access to this resource is limited to pipes in supplemental areas. When there are failures in these pumps, it can lead to devestating impacts on these remote states, thus leading to families suffering. What if we could predict when these events were likely to happen?

Problem Statement

Based on the given sensor data, when will a water pump fail?

Motivation

Back home in India, access to water at a steady rate, even in the city is a major problem. It especially is an issue for agriculture because of how reliant the village is for harvesting and food consumption. In my dad's village, there is always a consistent outage of water at random times—or so random it seems. I'd like to be able to reconstruct this in a smaller scale to hopefully assist my dad's village in a larger scale.

Reference Links:

  • BBC Articles on Tech Solutions for Indian Water Supply
  • Water.org Article on Indian Water Crisis
  • Water Project Article on Water Supply Crisis

Looking at The Data

This data set was obtained via Kaggle, but the interesting part is that I get to work Iot sensor data. The entries here are raw outputs from 52 different sensors, so I have to develop my own data pipeline to clean and use the data to predict an outage (I consider it an interesting procesing and prediction challenge).

Data Dictionary:

  • Unnamed (int): Unnamed column to be removed
  • Timestamp (Date): Date and timestamp of when the measurement was taken
  • sensor_00 to sensor_51 (float): 52 series measurements of water flow rate (measurement still unknown)
  • machine_status (Sensor Status Object): Status of the machine, either NORMAL, RECOVERING, OR BROKEN

Data Overview:

Source: [https://www.kaggle.com/datasets/nphantawee/pump-sensor-data]

In [1]:
import pandas as pd
df = pd.read_csv('sensor.csv')
df.head(5)
Out[1]:
Unnamed: 0 timestamp sensor_00 sensor_01 sensor_02 sensor_03 sensor_04 sensor_05 sensor_06 sensor_07 ... sensor_43 sensor_44 sensor_45 sensor_46 sensor_47 sensor_48 sensor_49 sensor_50 sensor_51 machine_status
0 0 2018-04-01 00:00:00 2.465394 47.09201 53.2118 46.310760 634.3750 76.45975 13.41146 16.13136 ... 41.92708 39.641200 65.68287 50.92593 38.194440 157.9861 67.70834 243.0556 201.3889 NORMAL
1 1 2018-04-01 00:01:00 2.465394 47.09201 53.2118 46.310760 634.3750 76.45975 13.41146 16.13136 ... 41.92708 39.641200 65.68287 50.92593 38.194440 157.9861 67.70834 243.0556 201.3889 NORMAL
2 2 2018-04-01 00:02:00 2.444734 47.35243 53.2118 46.397570 638.8889 73.54598 13.32465 16.03733 ... 41.66666 39.351852 65.39352 51.21528 38.194443 155.9606 67.12963 241.3194 203.7037 NORMAL
3 3 2018-04-01 00:03:00 2.460474 47.09201 53.1684 46.397568 628.1250 76.98898 13.31742 16.24711 ... 40.88541 39.062500 64.81481 51.21528 38.194440 155.9606 66.84028 240.4514 203.1250 NORMAL
4 4 2018-04-01 00:04:00 2.445718 47.13541 53.2118 46.397568 636.4583 76.58897 13.35359 16.21094 ... 41.40625 38.773150 65.10416 51.79398 38.773150 158.2755 66.55093 242.1875 201.3889 NORMAL

5 rows × 55 columns

In [2]:
df.shape
Out[2]:
(220320, 55)
In [3]:
df.columns
Out[3]:
Index(['Unnamed: 0', 'timestamp', 'sensor_00', 'sensor_01', 'sensor_02',
       'sensor_03', 'sensor_04', 'sensor_05', 'sensor_06', 'sensor_07',
       'sensor_08', 'sensor_09', 'sensor_10', 'sensor_11', 'sensor_12',
       'sensor_13', 'sensor_14', 'sensor_15', 'sensor_16', 'sensor_17',
       'sensor_18', 'sensor_19', 'sensor_20', 'sensor_21', 'sensor_22',
       'sensor_23', 'sensor_24', 'sensor_25', 'sensor_26', 'sensor_27',
       'sensor_28', 'sensor_29', 'sensor_30', 'sensor_31', 'sensor_32',
       'sensor_33', 'sensor_34', 'sensor_35', 'sensor_36', 'sensor_37',
       'sensor_38', 'sensor_39', 'sensor_40', 'sensor_41', 'sensor_42',
       'sensor_43', 'sensor_44', 'sensor_45', 'sensor_46', 'sensor_47',
       'sensor_48', 'sensor_49', 'sensor_50', 'sensor_51', 'machine_status'],
      dtype='object')
In [4]:
df.describe()
Out[4]:
Unnamed: 0 sensor_00 sensor_01 sensor_02 sensor_03 sensor_04 sensor_05 sensor_06 sensor_07 sensor_08 ... sensor_42 sensor_43 sensor_44 sensor_45 sensor_46 sensor_47 sensor_48 sensor_49 sensor_50 sensor_51
count 220320.000000 210112.000000 219951.000000 220301.000000 220301.000000 220301.000000 220301.000000 215522.000000 214869.000000 215213.000000 ... 220293.000000 220293.000000 220293.000000 220293.000000 220293.000000 220293.000000 220293.000000 220293.000000 143303.000000 204937.000000
mean 110159.500000 2.372221 47.591611 50.867392 43.752481 590.673936 73.396414 13.501537 15.843152 15.200721 ... 35.453455 43.879591 42.656877 43.094984 48.018585 44.340903 150.889044 57.119968 183.049260 202.699667
std 63601.049991 0.412227 3.296666 3.666820 2.418887 144.023912 17.298247 2.163736 2.201155 2.037390 ... 10.259521 11.044404 11.576355 12.837520 15.641284 10.442437 82.244957 19.143598 65.258650 109.588607
min 0.000000 0.000000 0.000000 33.159720 31.640620 2.798032 0.000000 0.014468 0.000000 0.028935 ... 22.135416 24.479166 25.752316 26.331018 26.331018 27.199070 26.331018 26.620370 27.488426 27.777779
25% 55079.750000 2.438831 46.310760 50.390620 42.838539 626.620400 69.976260 13.346350 15.907120 15.183740 ... 32.812500 39.583330 36.747684 36.747684 40.509258 39.062500 83.912030 47.743060 167.534700 179.108800
50% 110159.500000 2.456539 48.133678 51.649300 44.227428 632.638916 75.576790 13.642940 16.167530 15.494790 ... 35.156250 42.968750 40.509260 40.219910 44.849540 42.534720 138.020800 52.662040 193.865700 197.338000
75% 165239.250000 2.499826 49.479160 52.777770 45.312500 637.615723 80.912150 14.539930 16.427950 15.697340 ... 36.979164 46.614580 45.138890 44.849540 51.215280 46.585650 208.333300 60.763890 219.907400 216.724500
max 220319.000000 2.549016 56.727430 56.032990 48.220490 800.000000 99.999880 22.251160 23.596640 24.348960 ... 374.218800 408.593700 1000.000000 320.312500 370.370400 303.530100 561.632000 464.409700 1000.000000 1000.000000

8 rows × 53 columns

Sources of Data Problems

Because this data is entirely sensor data, there a lot of pre-processing work to do to standardize the data values. This could result in data truncation and leakage as some of the precision may be lost during the conversion. Nonetheless, we expect to have a relatively accurate prediction of outages.

Data Analysis & Modeling Overview

At a very high level, we know that having 52 entries of sensors is useful in that we have 52 different measurements for each time interval, which will result in accurate predictions for our model later on. We also know that having over 220,000 entries means that our model will have enough testing and training data to make accurate predictions as to when an outage is likely to occur.

The data also contains our target variable (Machine Status), as that is what we are trying predict using this data set. Because our target variable can only have 3 different status values as aforementioned, this project becomes a classification problem. Hence, we can use a variety of ML models, including but not limited to KNN, Random Forest, and SVM. We will likely implement a variety of these models to show which one is most accurate.