pandemic relief

Part 1

(1%) Describes and motivates a real-world problem where data science may provide helpful insights. Your description should be easily understood by a casual reader and include citations to motivating sources or relevant information (e.g. news articles, further reading links … Wikipedia makes for a poor reference but the links it cites are usually promising).

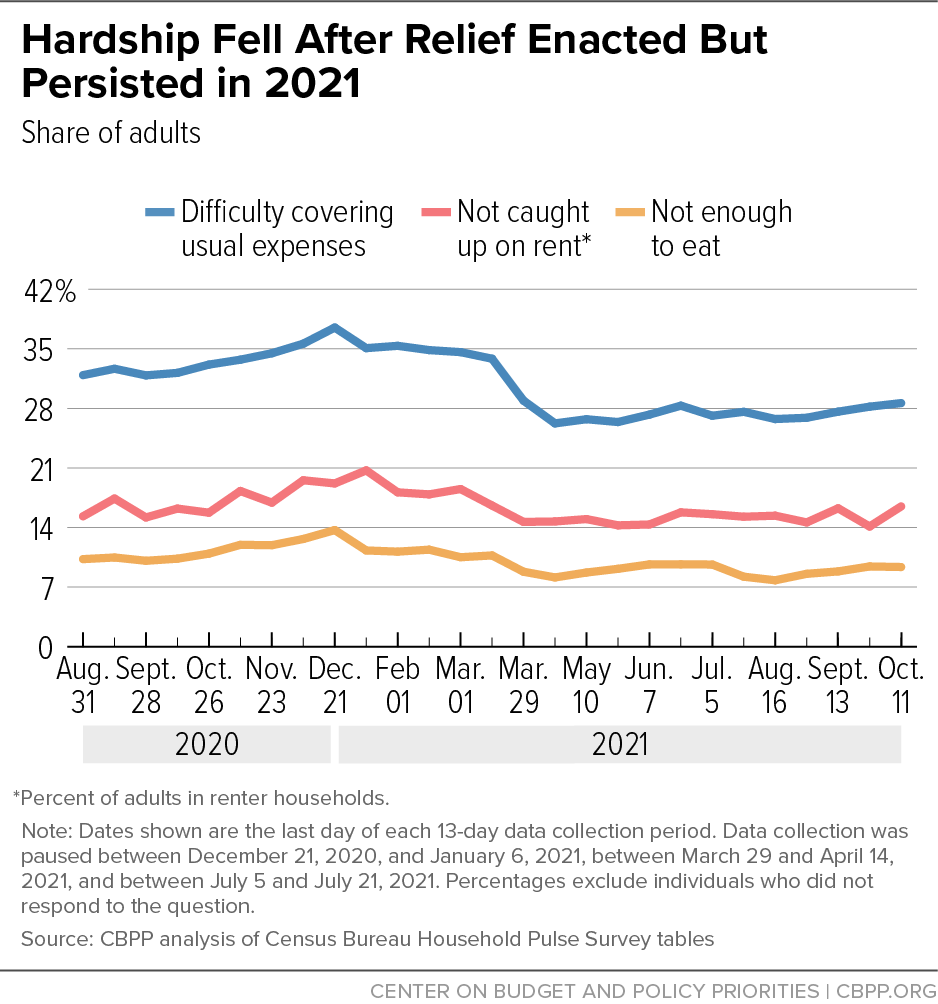
The project i wanted to focus on is an issue that has interested me for a long time now. It also happens to be a large issue in many places around the world. This is the effect of the pandemic on the global economy. It is obvious that the pandemic has had a significant impact on the global ecnonomy, reaching many areas such as food insecurity and homelessness. This can be seen in the graph below:

I believe it will be very interesting to bring the extent of the pandemics damage on society to light. This can lead to possible methods in which communities can improve their infrastructure. Furthermore it will be incredibky useful to be able to see not only how the pandemic impacted our communities but those all around the world as well.

Part 2

(1%) Explicitly load and show your dataset. Provide a data dictionary which explains the meaning of each feature present. Demonstrate that this data is sufficient to make progress on your real-world problem described above.

In [5]:
import pandas as pd
df_covid = pd.read_csv('raw_data.csv')
df_covid.head(300)
Out[5]:
iso_code location date total_cases total_deaths stringency_index population gdp_per_capita human_development_index Unnamed: 9 Unnamed: 10 Unnamed: 11 Unnamed: 12 Unnamed: 13
0 AFG Afghanistan 2019-12-31 0.0 0.0 0.00 38928341 1803.987 0.498 #NUM! #NUM! #NUM! 17.477233 7.497754494
1 AFG Afghanistan 2020-01-01 0.0 0.0 0.00 38928341 1803.987 0.498 #NUM! #NUM! #NUM! 17.477233 7.497754494
2 AFG Afghanistan 2020-01-02 0.0 0.0 0.00 38928341 1803.987 0.498 #NUM! #NUM! #NUM! 17.477233 7.497754494
3 AFG Afghanistan 2020-01-03 0.0 0.0 0.00 38928341 1803.987 0.498 #NUM! #NUM! #NUM! 17.477233 7.497754494
4 AFG Afghanistan 2020-01-04 0.0 0.0 0.00 38928341 1803.987 0.498 #NUM! #NUM! #NUM! 17.477233 7.497754494
... ... ... ... ... ... ... ... ... ... ... ... ... ... ...
295 ALB Albania 2020-03-10 6.0 NaN 41.67 2877800 11803.431 0.785 1.791759469 #NUM! 3.729781445 14.872537 9.376145531
296 ALB Albania 2020-03-11 10.0 NaN 51.85 2877800 11803.431 0.785 2.302585093 #NUM! 3.948354935 14.872537 9.376145531
297 ALB Albania 2020-03-12 11.0 1.0 51.85 2877800 11803.431 0.785 2.397895273 0 3.948354935 14.872537 9.376145531
298 ALB Albania 2020-03-13 23.0 1.0 78.70 2877800 11803.431 0.785 3.135494216 0 4.365643155 14.872537 9.376145531
299 ALB Albania 2020-03-14 33.0 1.0 78.70 2877800 11803.431 0.785 3.496507561 0 4.365643155 14.872537 9.376145531

300 rows × 14 columns

Above is the first 300 rows of the dataset I have selected to support my research. I found it through Kaggle and it is created/owned by Shaswat Tiwari. It contains a country code/abbreviation, the location and each day from December 2019 to October 2020. It them displays information about total cases, total deaths and stringency index which is essentially a metric that displays school and work closures and travel bans. The final three columns are probably the most important being population, gdp per capita and the human development index. All this information is crucial to drawing interesting conclusions about how Covid-19 affected 170 different countries around the world. Also just as a disclaimer, this is raw data that needs to be cleaned up, and for that reason there are a couple unnamed columns at the end of the file.

Part 3

(1%) Write one or two sentences about how the data will be used to solve the problem.

I plan on comparing the HDI metric with the GPD per capita, which may give us some unexpected answers about certain regions being affected in terms of quality of life more than others. It may also be interesting to compare this data back to the total cases and deaths by Covid-19 as a benchmark of how the contry was affected. This aims to provide useful information about more vulnerable areas which may need more support in case of future emergency.