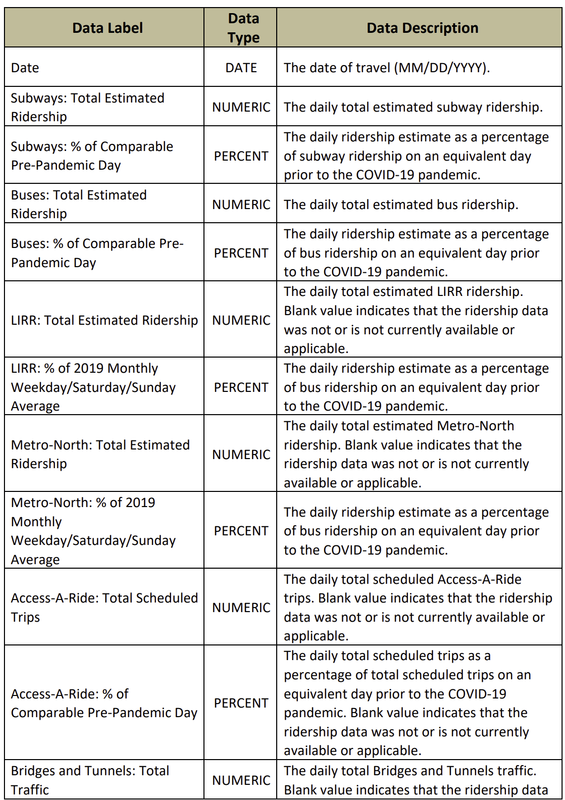
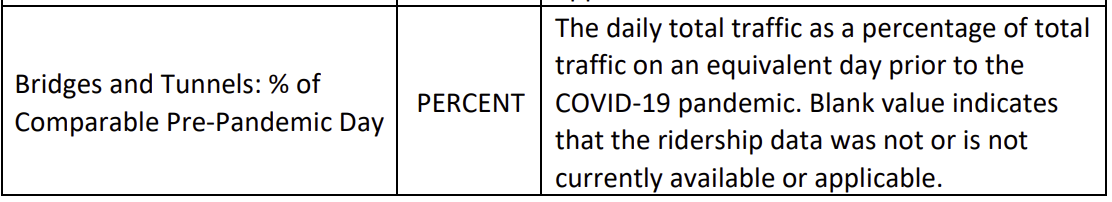
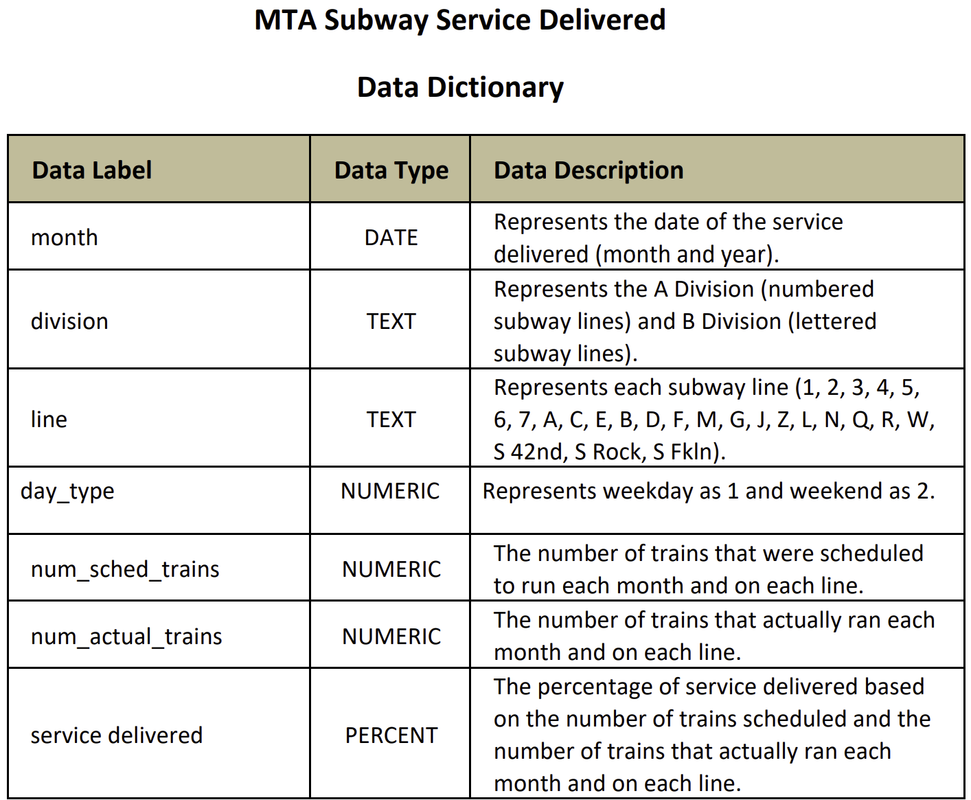
Ridership Data Dictionary
The MTA (Metropolitian Transport Authority) is the New York State government authority that controls public transport in the New York City Metropolitain Area. This includes the Subway, Metro-North, Long Island Railroads, and the buses. The effeciency of the MTA is crucial for the City to run smoothly. One of the issues, though, is that as with most public transport systems, it is not perfect, and delays are common. It feels as though recently it has gotten even worse, with negative news articles, such as Crew Shortages cause Delays, becoming even more common.
Using data on delays, it is possible to see which lines and which days have had the most delays, and outliers will be obvious. Ridership data will also be useful, and it can be used to see how ridership flucuates between days, months, and even years. Data on both will be readily available using the MTA's and New York state's databases. It will also be useful to cross reference trends and outliers with major outside events and other sources (one example is the COVID-19 pandemic and how it impacted ridership).
For this project I am using two datasets. Both are from New York State. The first data set is daily ridership data for the past 3 years (Daily Ridership Data). The other dataset is about delays every month for the past 3 years (Delays Dataset).
#load the datasets
import pandas as pd

daily_ridership_df = pd.read_csv('MTA_Daily_Ridership_Data__Beginning_2020.csv')
delays_df = pd.read_csv('MTA_Subway_Service_Delivered__Beginning_2020.csv')
#ridership data
daily_ridership_df.head()
| Date | Subways: Total Estimated Ridership | Subways: % of Comparable Pre-Pandemic Day | Buses: Total Estimated Ridership | Buses: % of Comparable Pre-Pandemic Day | LIRR: Total Estimated Ridership | LIRR: % of 2019 Monthly Weekday/Saturday/Sunday Average | Metro-North: Total Estimated Ridership | Metro-North: % of 2019 Monthly Weekday/Saturday/Sunday Average | Access-A-Ride: Total Scheduled Trips | Access-A-Ride: % of Comparable Pre-Pandemic Day | Bridges and Tunnels: Total Traffic | Bridges and Tunnels: % of Comparable Pre-Pandemic Day | |
|---|---|---|---|---|---|---|---|---|---|---|---|---|---|
| 0 | 02/23/2023 | 3499940 | 0.64 | 898699 | 0.42 | 188438.0 | 0.62 | 167193.0 | 0.62 | 27336 | 0.93 | 906322 | 1.03 |
| 1 | 02/22/2023 | 3458490 | 0.64 | 1010427 | 0.47 | 193753.0 | 0.64 | 171187.0 | 0.64 | 27895 | 0.95 | 869960 | 0.98 |
| 2 | 02/21/2023 | 3330546 | 0.61 | 1001993 | 0.47 | 194967.0 | 0.64 | 174283.0 | 0.65 | 27224 | 0.93 | 864047 | 0.98 |
| 3 | 02/20/2023 | 2239470 | 1.02 | 713171 | 0.73 | 90371.0 | 1.16 | 79984.0 | 0.88 | 14818 | 0.50 | 809578 | 1.07 |
| 4 | 02/19/2023 | 1824881 | 0.83 | 514773 | 0.53 | 75448.0 | 0.97 | 75064.0 | 0.82 | 16165 | 0.96 | 784650 | 1.04 |
delays_df.head()
| month | division | line | day_type | num_sched_trains | num_actual_trains | service delivered | |
|---|---|---|---|---|---|---|---|
| 0 | 2020-01 | A DIVISION | 1 | 1 | 1826 | 1773 | 0.970975 |
| 1 | 2020-01 | A DIVISION | 1 | 2 | 958 | 952 | 0.993737 |
| 2 | 2020-01 | A DIVISION | 2 | 1 | 2420 | 2322 | 0.959504 |
| 3 | 2020-01 | A DIVISION | 2 | 2 | 1866 | 1836 | 0.983923 |
| 4 | 2020-01 | A DIVISION | 3 | 1 | 2244 | 2174 | 0.968806 |
Using the ridership data, it would be possible to create a line graph of each day's number of riders on the subway. From there, one could look at any outliers, and cross reference those days with outside sources to look at potential reasons in the significant change. A line graph can also be created for the delays data, which can be used to look at outliers, by looking at months with extremely low percentage of on-time trains. Grouping by each line and looking at their average on-time percentage could be helpful to figure out which lines are the worst in terms of delays.
One potential problem is that the ridership data does not include data for specefic subway lines, so another data set may be needed to get more specefic on looking at individual subway lines. Also, the COVID-19 Pandemic will skew a lot of data, and may not represent the (mostly) COVID free environment now. Finally, the delays data only goes by month, so it will not be possible to determine the reasons for delays using only that dataset.