Midterm statistics are out. Homework 6 & 7 are released and due Nov 14 & Nov 21.
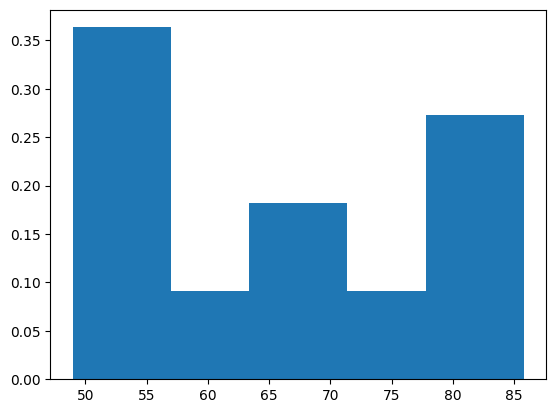
Midterms are graded and will be returned next week (November 7). The grade histogram appears bimodal. The statisics are as follows:
- Average score over all enrolled students = 69.2
- Median score over all enrolled students = 72.0
- Standard deviation is around 12 points
The distribution is shown below.

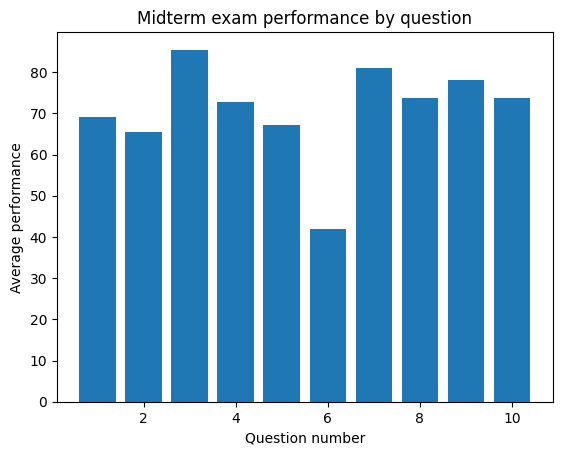
Breaking down the performance, the average scoring per question provides the following insights:
- Students most understood how to do PySpark joins
- Students least understood the intuition behind k-means.
On key concepts,
- Map reduce understanding remains middling
- Application of Bayesian Theory could be improved, but general concept understanding is apparent.
Average score by question is shown below.
