Midterms have been graded and statistics are available.
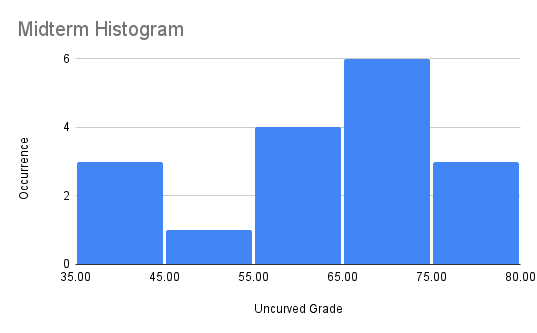
Midterms are graded and will be returned the week after next (March 21). The statisics are as follows:
- Average score over all enrolled students = 63
- Median score over all enrolled students = 65
- Standard deviation is = 13.4
The distribution is shown below.

Fine Grained Aggregate Performance
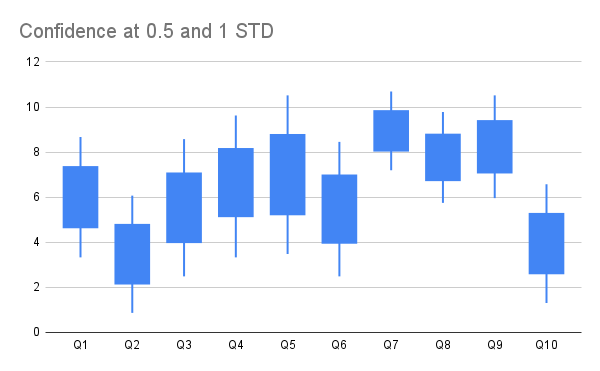
Breaking down the performance, the average scoring and confidence intervals are shown below (scaling STDEV = 0.25).

| Metric | Q1 | Q2 | Q3 | Q4 | Q5 | Q6 | Q7 | Q8 | Q9 | Q10 |
|---|---|---|---|---|---|---|---|---|---|---|
| Avg | 6 | 3.47 | 5.52 | 6.64 | 7 | 5.47 | 8.94 | 7.76 | 8.23 | 3.94 |
| STDev | 2.66 | 2.60 | 3.04 | 2.97 | 3.51 | 2.98 | 1.74 | 2.01 | 2.27 | 2.63 |
| Low | 3.33 | 0.86 | 2.48 | 3.33 | 3.48 | 2.48 | 7.19 | 5.74 | 5.95 | 1.30 |
| High | 8.66 | 6.07 | 8.57 | 9.62 | 10.5 | 8.45 | 10.6 | 9.78 | 10.5 | 6.57 |
Insights per question:
- Questions 2 (Lone Wolves and Influencers) and 10 (KBB, Bayes Theory) were the most difficult
- Question 5 (Maximum Likelihlood) had the most amount of variance
- Question 7 and 8 (Association Rules) People appear to generally understand frequent itemsets