Computer Graphics (CS 4300) 2010S: Lecture 5
Today
- update to HW2 and HW3: may work in pairs
- review midpoint algorithm
- introduce sampling and antialiasing
- color perception, color spaces
Sampling and Antialiasing
- “a pixel is not a little square”
- rather, it is a sampling point, typically at the center of the “little square”
- taking this perspective, revisit line drawing
- assume desired line is a 1-pixel wide rectangle (there we go assuming pixels are little squares) centered on the line
- sampling perspective: check if the sampling point corresponding to each screen pixel is inside the rectangle
- if so, the line is “on” the pixel
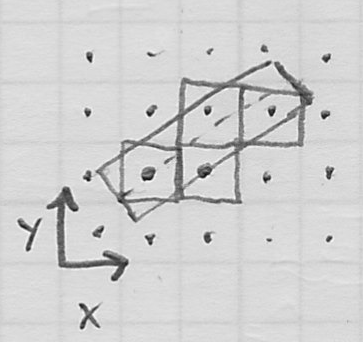
- resulting set of pixels is the same as would be computed by the midpoint algorithm
- could literally implement this sampling, but naieve implementation would require checking all pixels on screen for every line
- midpoint algorithm is much faster
- “jaggies” of a line rendered by turning pixels fully on or off are an example of aliasing
- aliasing is a general property of any kind of sampling, where a continuous object (in this case the rectangle representing the line) is represented by a finite set of discrete samples
- because some information is generally lost by sampling, the samples may not exactly reconstruct the original continuous object
- in some cases, the same set of sample values can result from two very different original continuous objects (this is the origin of the word aliasing)
- we can make line rasterization look better by using gray levels rather than just on/off: antialiasing
- one way is supersampling
- divide each original pixel into four subpixels (this is 2x supersampling, can divide further for additional quality)
- now re-sample the same rectangle representing the line with the finer grid of sample points
- finally, average the four subpixels for each original pixel to arrive at a gray level of 0.0, 0.25, 0.5, 0.75, or 1.0
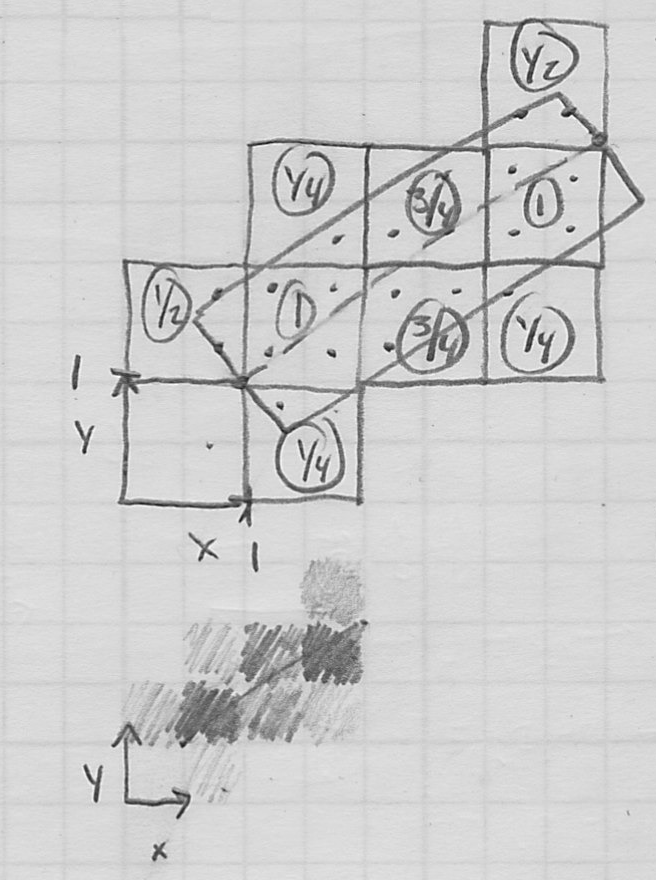
- in practice, still need to find a fast way to compute an equivalent result
What is Color?
- from physics, we know that the wavelength of a photon (typically measured in nanometers, or billionths of a meter) determines its apparent color
- we cannot see all wavelengths, but only the visible spectrum from around 380 to 750 nm

- but where are the following colors: “brown”, “pink”, “white”, …?
- clearly, the color spectrum does not actually contain all colors; i.e. some colors are non-spectral
- generally, a large number of photons with different wavelengths are simultaneosly impinging on any given location of your retina
- the actual incident light is not of a single wavelength, but can be described by a spectral histogram

- the histogram represents the relative quantity of photons of each wavelength
- the human eye cannot determine the exact histogram
- in fact just representing a complete spectral histogram exactly would require an infinite amount of space because it’s a continous quantity
- the biological solution is another form of sampling
- three types of cone cells respond (with the equivalent of a single number each) to the degree to which the actual incident histogram is similar to response histograms with peaks near red, green, and blue

- so the original continous histogram impinging on one location of your retina is reduced to three measurements
- (actually, there is a fourth rod cell type, which is mainly active in low light conditions)
- color blindness is typically caused by anomalies in the types of cone cells
- other animals also have different cone cells
- because we have again converted a continuous object into a set of discrete samples, we have to consider aliasing
- different incident histograms, called metamers, may be mapped to the same set of cone cell responses
- how many distinct colors can be seen?
- one way to think about it is to know that each cone cell type can distinguish between about 100 intensity levels of the associated response curve, and then to take a constructive approach
- there are
 =1M ways to combine cone cell responses, so avg human can distinguish roughly that many colors
- the biology of human cone cells is the not only the reason we often use RGB to represent color; in fact, it defines color. Color is not an intrinsic property of light, but rather a result of the interaction between human cone cells and histograms of incident light.

Color Spaces
- we can make an abstract color space by assigning one color to each axis in a 3D Cartesian space
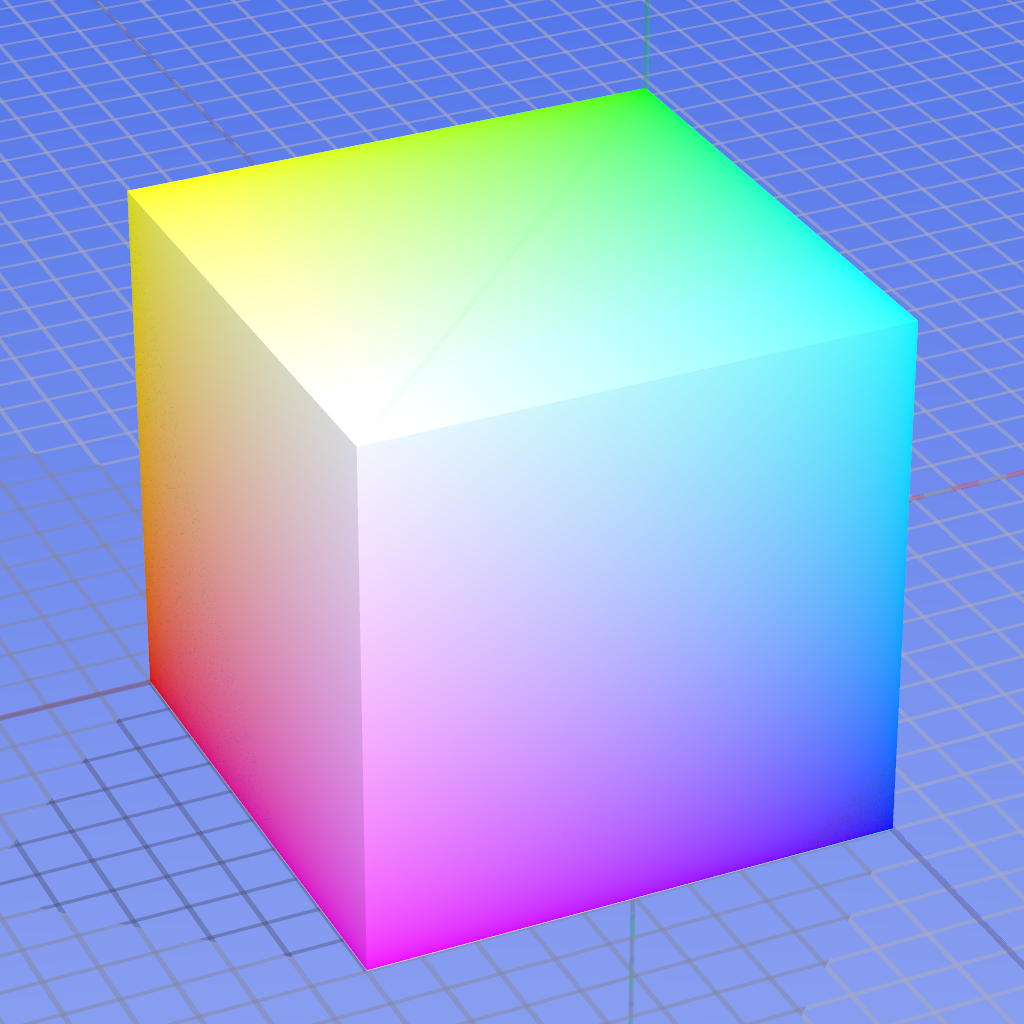
- the other vertices of the cube correspond to mixes of colors: “cyan”, “magenta”, “yellow”, “white”, and “black”
- sometimes RGB are considered “additive” colors because they form a basis for the color space relative to black
- CMY can similarly be considered “subtractive” colors because, effectively
- cyan+red = white
- magenta+green = white
- yellow+blue = white

- additive colors typically used when light is generated by an output device (e.g. CRT, LCD)
- subtractive colors typically used when printing on white paper
- sometimes RGB and CMY are considered distinct color spaces
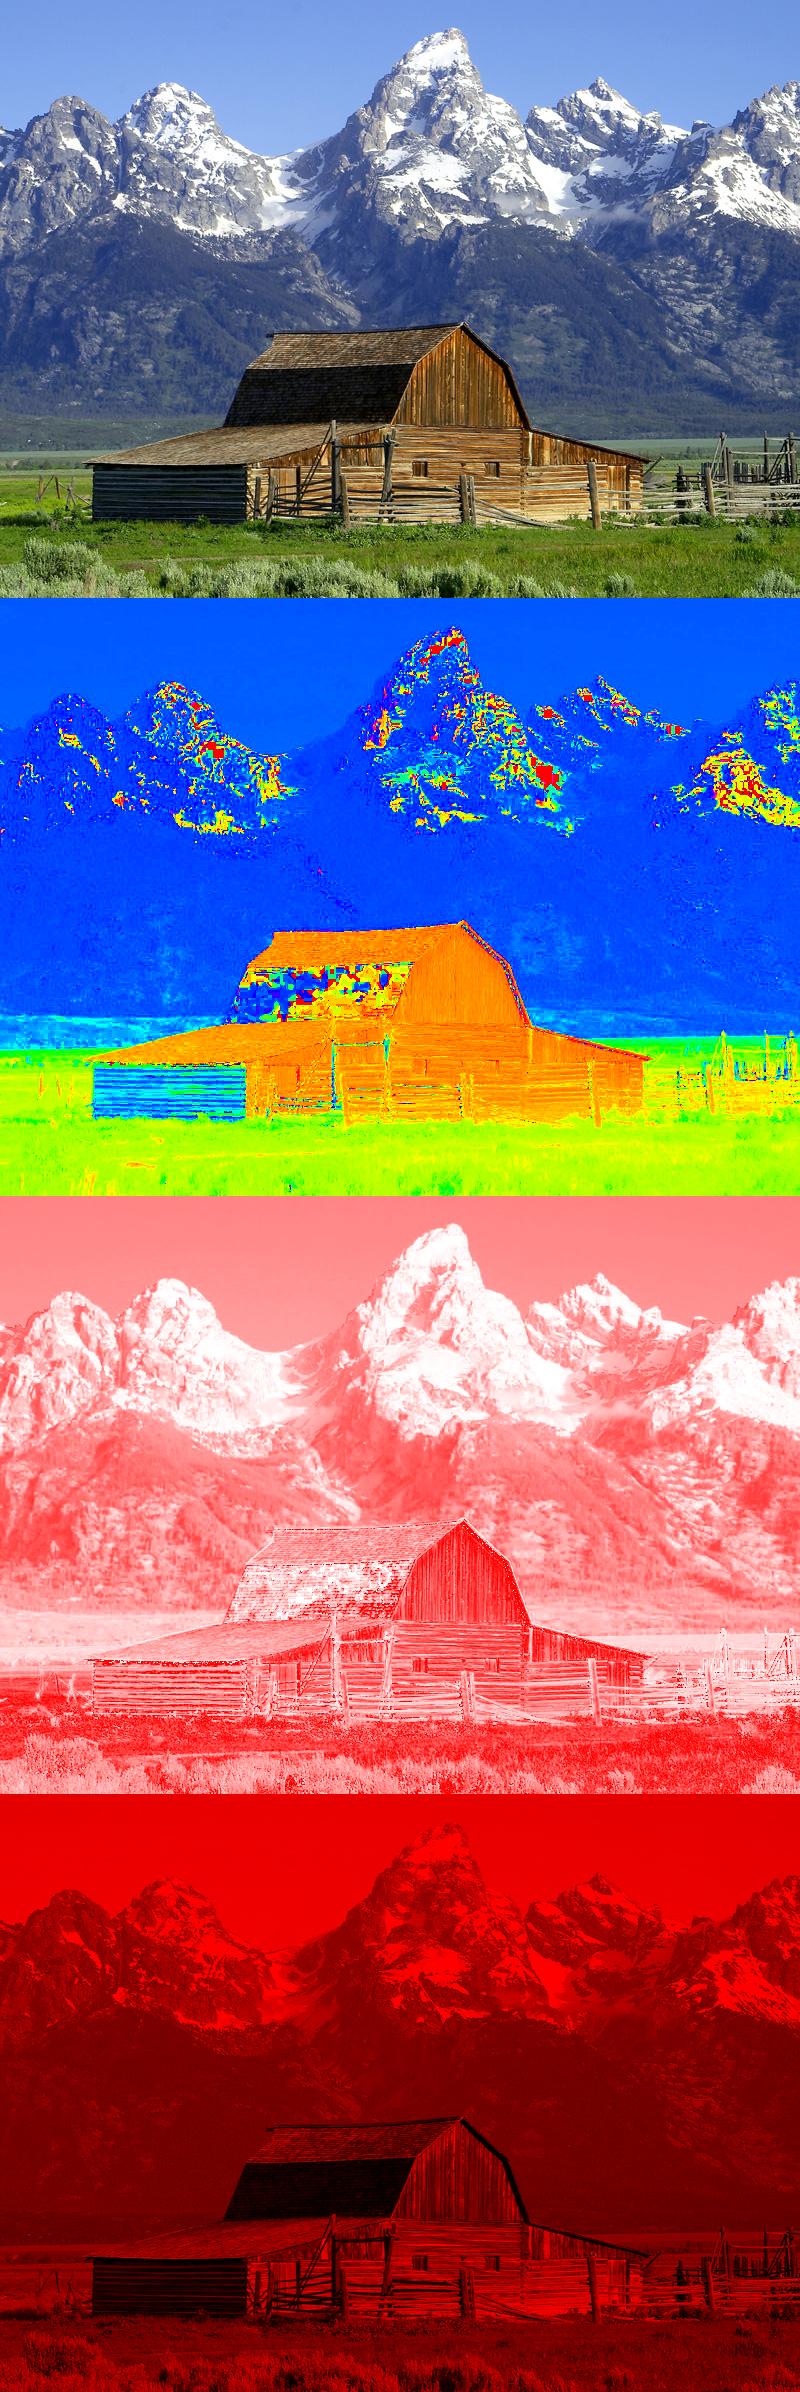
- another common and useful color space is HSV
- hue: the basic color, or chromaticity
- saturation: how “deep” the color is (vs “pastel”)
- value: the brightness of the color
- HSV is again a 3 dimensional space, but it is typically considered to use cylindrical coordinates
- this is mainly a construction to decompose the three dimensional color space in a way that is more useful to human designers
- also often useful in machine vision algorithms, which simulate our theories of (aspects of) human vision
- can visualize HSV space as a “morph” of RGB space
- “stretch” the white and black vertices up and down
- “line up” the remaining six vertices along a common horizontal plane

- for HSV, put the white vertex back onto plane
 (a variation, HSL, keeps white and black symetrically above and below
  )
) 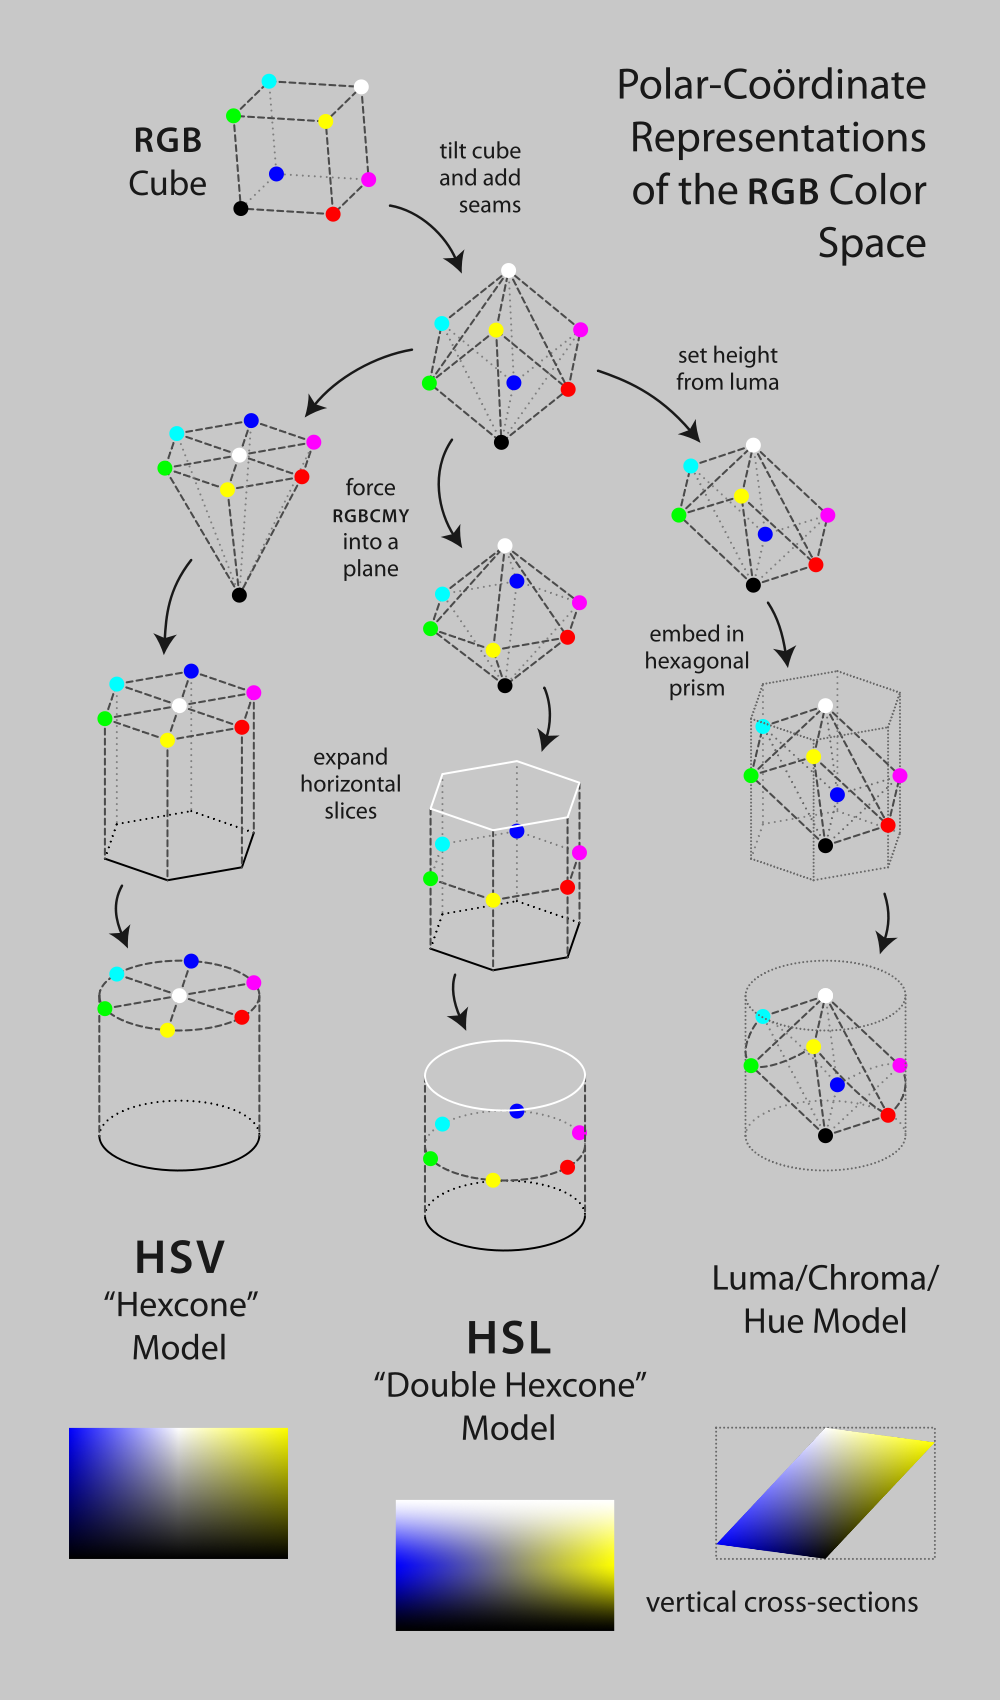
- hue is the radial angle “around” the cylinder
- saturation is the radial distance “out” from the center of the cylinder
- lightness is the “height” from the bottom to the top of the cylinder

- a common color picker uses the HSV model, with a rotating triangle inscribed inside a “hue circle”

Next Time
- images: compression, alpha blending, image scaling
- reading on website


