Assignment 5: ExCELlence —
Due: Mon 10/29 at 9:00pm; self-evaluation due Tue 10/30 at 10:00pm
This assignment is to be completed with a partner. You will sign up with your partner on the handin server from this assignment onwards. You will not be able to submit subsequent assignments until you are part of a team on the handin server.
If you do not know (or remember) how to request teams, follow
these
instructions. Please request teams no later than Wednesday night at
9pm —
1 Context
A picture is worth a thousand words, and moving pictures are worth many more.
Pictures and moving pictures (animations) can be used to succinctly and effectively illustrate many things. For example, a stationary histogram visually depicts the distribution of some data points. A histogram with moving bar heights visually depicts music (e.g. a music equalizer). Animating graphs can be used to show useful trends in data much more effectively than presenting the same reasoning using raw numbers and text (see here for a visualization of the trend of life expectancy with GDP over time using only circles). A fireworks display is simply a bunch of points moving in certain ways. The Towers of Hanoi problem can be illustrated more effectively as an animation solving it, rather than a description of steps of an algorithm. Many algorithms can be similarly visualized in a way that illustrates how they work more succinctly than descriptions or code. Here are some examples of such visualizations:
|
|
|
|

One of the more frustrating experiences is knowing what to visualize, having a plan for how to visualize it using simple shapes and animations, but not being able to quickly create such an animation. Creating animations takes time, and one must learn the necessary tools that are often difficult to master (e.g., using Flash, or creating Web animations using HTML5 and Javascript, etc.). Such tools are often also special-purpose. For example, the statistical package R comes with charting capabilities, but code must be written in R and data must be formatted accordingly. Similarly creating animations is not difficult in Powerpoint, but the tool is embedded in Powerpoint and one cannot use it to create other kinds of animation.
In the next few assignments, we will build an application that helps to create simple but effective 2D animations from shapes (such as the above examples). One of our main goals will be to create a separation between how an algorithm or phenomenon is described and how it is drawn on the screen. This separation will allow us to create an application that will draw an animation according to how it is described in text, without being tied to how the description was produced. This process is illustrated below:
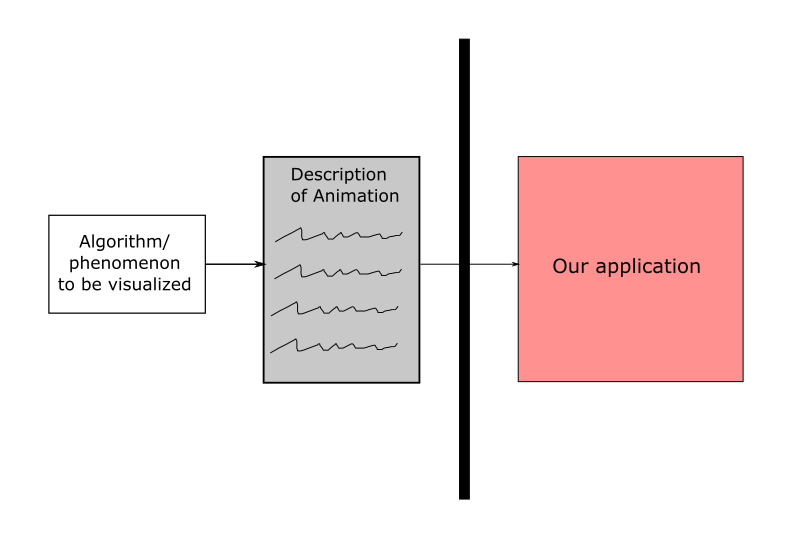
In other words, our application will show animations generated manually or using any other program, unrelated to our application.
1.1 Description of animation
In informal language, here is an example description of the animation for the "Simple Animation" example above:
Create red rectangle R with corner at (200,200), width 50 and height 100
Create blue oval C with center at (500,100), radius 60 and 30

R appears at time t=1 and disappears at time t=100
C appears at time t=6 and disappears at time t=100

R moves from (200,200) to (300,300) from time t=10 to t=50
C moves from (500,100) to (500,400) from time t=20 to t=70
C changes from blue to green from time t=50 to t=80
R moves from (300,300) to (200,200) from time t=70 to t=100
R changes width from 50 to 25 from time t=51 to t=70
This description is terse and readable, but it is difficult to work with. There are "gaps" in the timeline where nothing is specified for a given shape (e.g. t=0 to t=10), there are overlapping ranges of changes (e.g. C changes both position and color, but not in sync), etc. We might prefer a slightly different description: more verbose perhaps, but also more explicit: Note: this description has been changed to fix all the bugs pointed out on Piazza. Sorry for the confusion.
Create rectangle named "R"
Create oval named "C"

From time 1 to 10, R moves from (200,200) to (10,200), stays size 50x100, and stays red.
From time 10 to 50, R moves from (10,200) to (300,300), stays size 50x100, and stays red.
From time 50 to 51, R does nothing.
From time 51 to 70, R stays put, shrinks from 50x100 to 25x100, and stays red.
From time 70 to 100, R moves from (300,300) to (200,200), stays size 25x.100, and stays red.

From time 6 to 20, C stays put at (440,70), stays size 120x60, and stays blue.
From time 20 to 50, C moves from (440,70) to (440,250), stays size 120x60 and stays blue.
From time 50 to 70, C moves from (440,250) to (440,370), stays size 120x60, and turns green-blue.
From time 70 to 80, C stays put at (440,370), stays size 120x60, and turns green.
From time 80 to 100, C stays put at (440,370), stays size 120x60, and stays green.
This text describes the animation in terms of what the shapes should look like at key moments1In traditional, hand-drawn animation, such frames were called cels. in a timeline, and the animation moves smoothly between each such moment. This is called “declarative animation.” Imagine how you would describe informally the above Towers of Hanoi animation in this way.
The description above uses numbers to measure times on the animation’s timeline, and we treat these as unitless “ticks”, so we can describe an animation without mentioning its absolute speed. Further, the animation must adhere to certain constraints: none of the motions described can overlap, and any adjacent motions must agree on their common endpoint: shapes can’t “teleport” unless we explicitly tell them to. (What might that description look like?)
Our application may then use such a description to:
“Show” the animation in various ways. For example interactively play it, show individual still frames, or even export the animation as a movie.
Allow a user to edit it or change speed.
Produce a verbose description for what the animation will look like (for the visually impaired).
Other possibilities...
2 ExCELlence: The Easy Animator Application
We will build this application progressively using the classic Model-View-Controller architecture. In this assignment we will focus on the model of this application. There is no starter code for this assignment: you must use the above description and broad ideas to design the interface and implementation of the model. You are deliberately not being told about the fine details of what the controller and views will need or do. You are also not being told about how exactly the application will receive a description from the user (it would not be relevant to the model).
Here are some aspects to think about:
What does the model represent?
The model should be able to support various kinds of 2D shapes, although currently we have described only rectangles and ovals.
The model should support at least describing the size, position, and color of shapes, though you might support additional features.
Remember to think from not only the implementor’s perspective (the person that is implementing the model) but also the client perspective (the people or classes that are using the model). What operations might they reasonably want to perform? What observations might they reasonably want to make?
2.1 How is the animation seen?
One way the application may show the animation is by actually playing it, similar to the moving images above. Another way would be to produce a text description of the animation. Here is what a description might look like: Note: this description has been changed to fix all the bugs pointed out on Piazza. Sorry for the confusion.
# declares a rectangle shape named R
shape R rectangle
# describes the motions of shape R, between two moments of animation:
# t == tick
# (x,y) == position
# (w,h) == dimensions
# (r,g,b) == color (with values between 0 and 255)
#                  start                           end
#        --------------------------    ----------------------------
#        t  x   y   w  h   r   g  b    t   x   y   w  h   r   g  b
motion R 1  200 200 50 100 255 0  0    10  200 200 50 100 255 0  0
motion R 10 200 200 50 100 255 0  0    50  300 300 50 100 255 0  0
motion R 50 300 300 50 100 255 0  0    51  300 300 50 100 255 0  0
motion R 51 300 300 50 100 255 0  0    70  300 300 25 100 255 0  0
motion R 70 300 300 25 100 255 0  0    100 200 200 25 100 255 0  0

shape C ellipse
motion C 6  440 70 120 60 0 0 255      20  440 70  120 60 0 0 255
motion C 20 440 70 120 60 0 0 255      50  440 250 120 60 0 0 255
motion C 50 440 250 120 60 0 0 255     70  440 370 120 60 0 170 85
motion C 70 440 370 120 60 0 170 85    80  440 370 120 60 0 255  0
motion C 80 440 370 120 60 0 255  0    100 440 370 120 60 0 255  0
Compare this output to the second English description above, to see how they correspond. (The lines beginning with # marks are meant to be comments.)
3 What to do
Design a model to represent an animation. This may consist of one or more interfaces, abstract classes, concrete classes, enums, etc. Consider carefully what operations it should support, what invariants it assumes, etc.
Document your model well. Be sure to document clearly what each type and method does, what purpose it serves and why it belongs in the model. If your model assumes any invariants, explain them.
Implement your model. If some method of your model cannot be implemented because it requires details of animation we have not yet provided, you may leave the method body blank for now —
but leave a comment inside the method body explaining why it’s empty and what details you’re waiting for. If your implementation makes additional assumptions about invariants (beyond those asserted by the interface), document them. Test your model thoroughly.
Implement the text output rendering of your model according to the format given in Section 2.1, so we can visualize your data. As with Assignment 2, you may implement this as a method on your model object for now; it will become its own view in the next assignment.
We will not be autograding this assignment, but you should emulate the output above as precisely as possible, as we will likely be checking it (on models constructed from input files we provide) on future assignments. Note: You do not need to produce comments or neatly aligned columns of text in your output; we added the spacing so it was clearer how to read the columns.
4 What to submit
Reminder: This assignment is to be completed with a partner. You will sign up with your partner on the handin server from this assignment onwards. You will not be able to submit subsequent assignments until you are part of a team on the handin server.
If you do not know (or remember) how to request teams, follow
these
instructions. Please request teams no later than Wednesday night at
9pm —
Submit any files created in this assignment, along with a text README file explaining your design. Your README file should give the graders an overview of what the purposes are for every class, interface, etc. that you include in your model, so that they can quickly get a high-level overview of your code. It does not replace the need for proper Javadoc!
5 Grading standards
For this assignment, you will be graded on
the design of your model interface(s), in terms of clarity, flexibility, and how plausibly it will support needed functionality;
the appropriateness of your representation choices for the data, and the adequacy of any documented class invariants (please comment on why you chose the representation you did in the code);
the forward thinking in your design, in terms of its flexibility, use of abstraction, etc.
the correctness and style of your implementation, and
the comprehensiveness and correctness of your test coverage.
6 Submission
Please submit your homework to https://handins.ccs.neu.edu/ by the above deadline. Then be sure to complete your self evaluation by its due date.
1In traditional, hand-drawn animation, such frames were called cels.